This page contains additional analysis not included in the original poster
GO and KEGG analysis of P7 Interneurons
| Figure 1. GO term analysis of overexpressed genes in the P7 cluster |
|---|
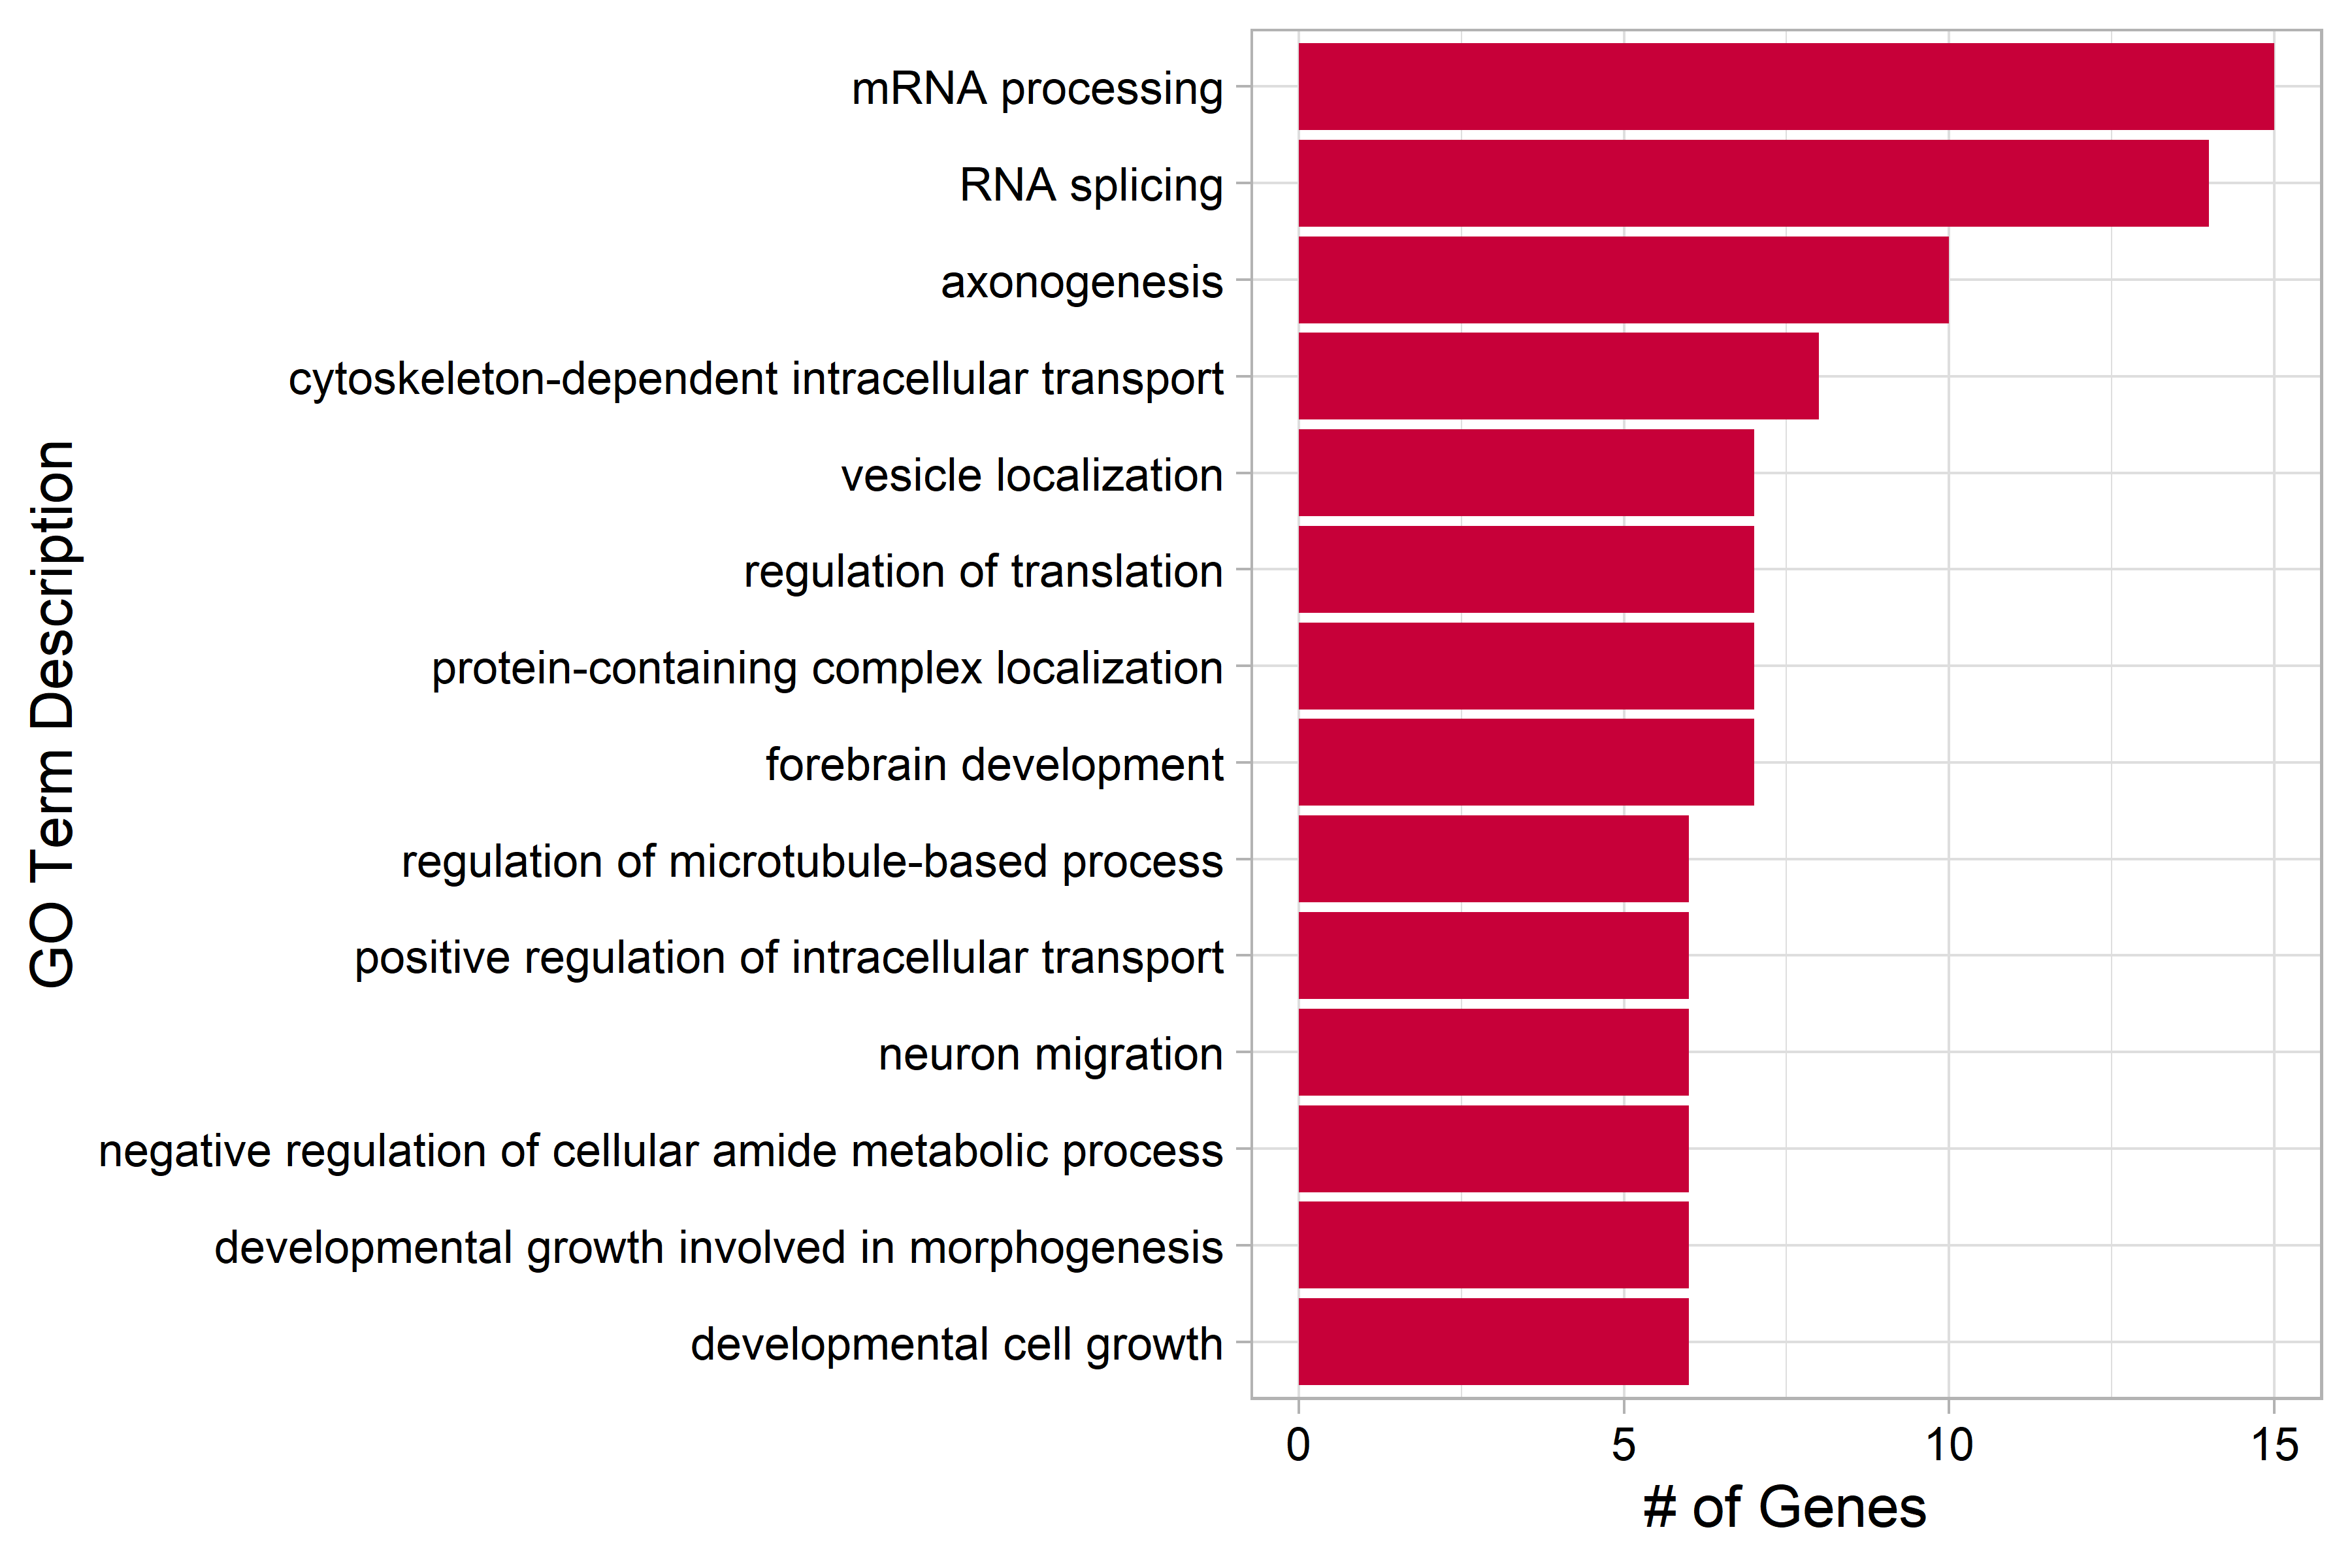 |
| Genes that were differentially overexpressed in the P7 cluster at least 2-fold on average (p < 0.01) were used for over representation analysis (ORA). The 20 terms with the most genes are shown here. |
| Figure 2. Network Plot of Relevant P7 GO terms |
|---|
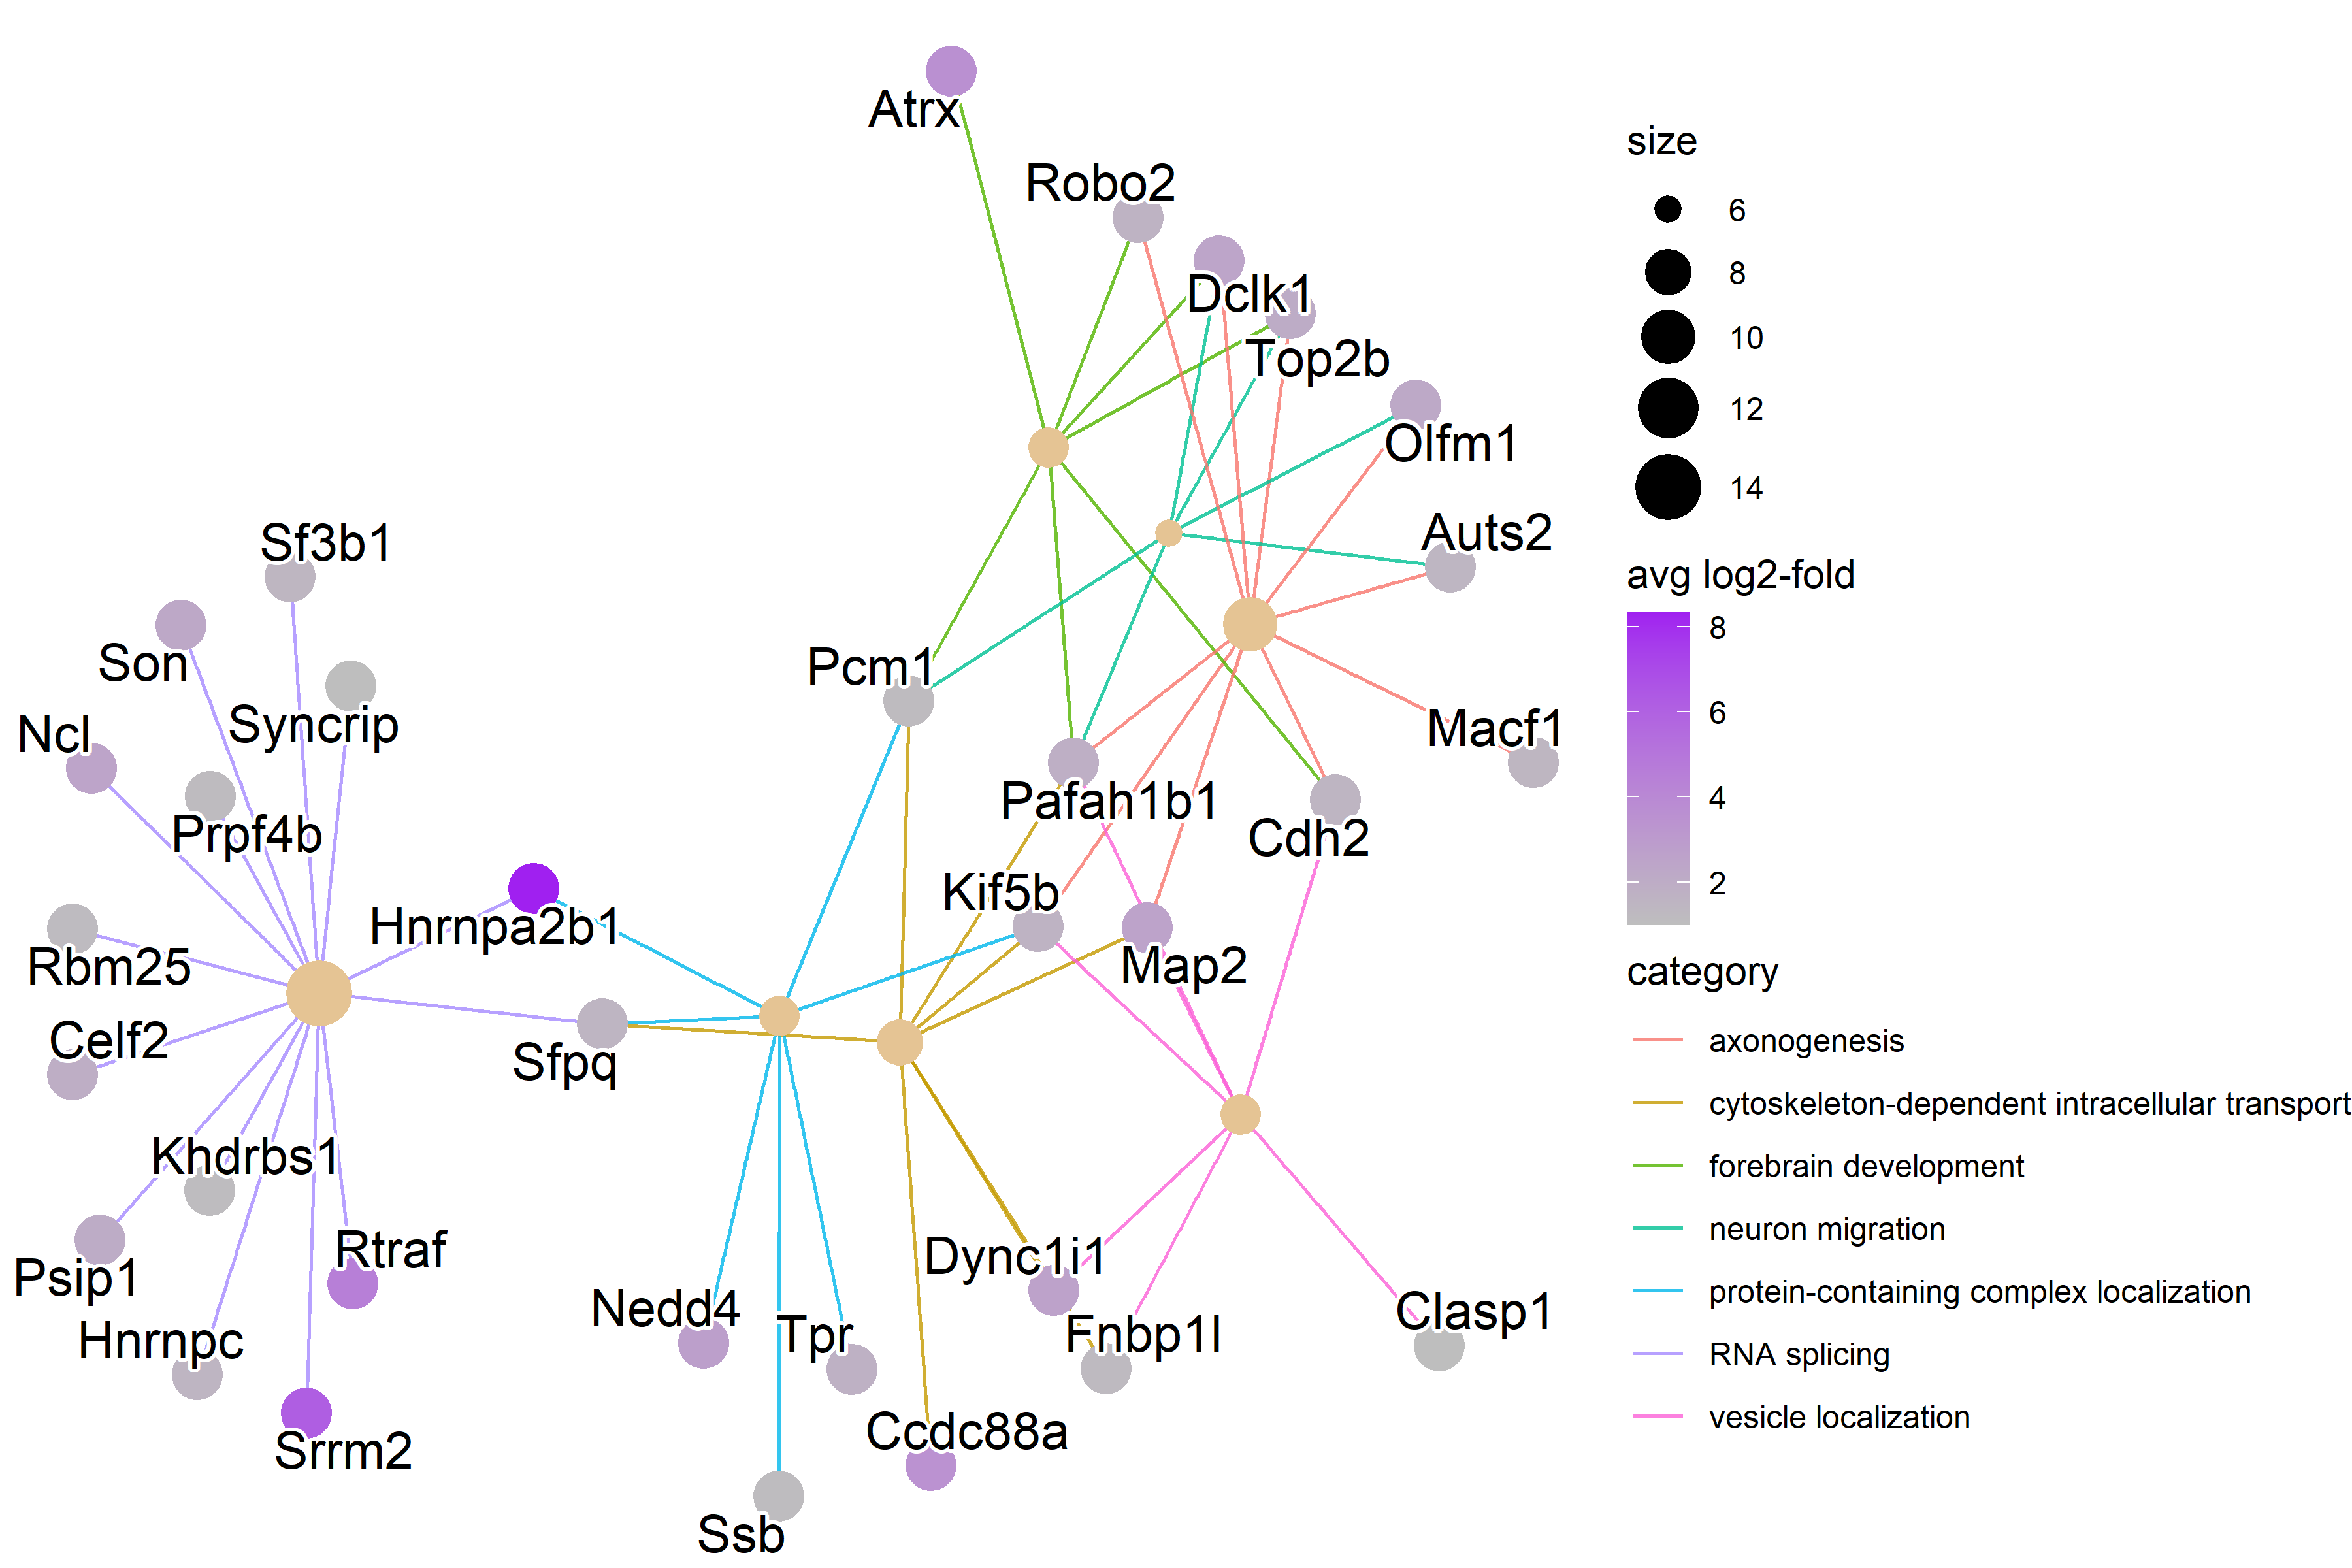 |
| RNA splicing genes have higher expression levels than the other categories. |
| Figure 3. GO Term Axonogenesis Genes by Timepoint |
|---|
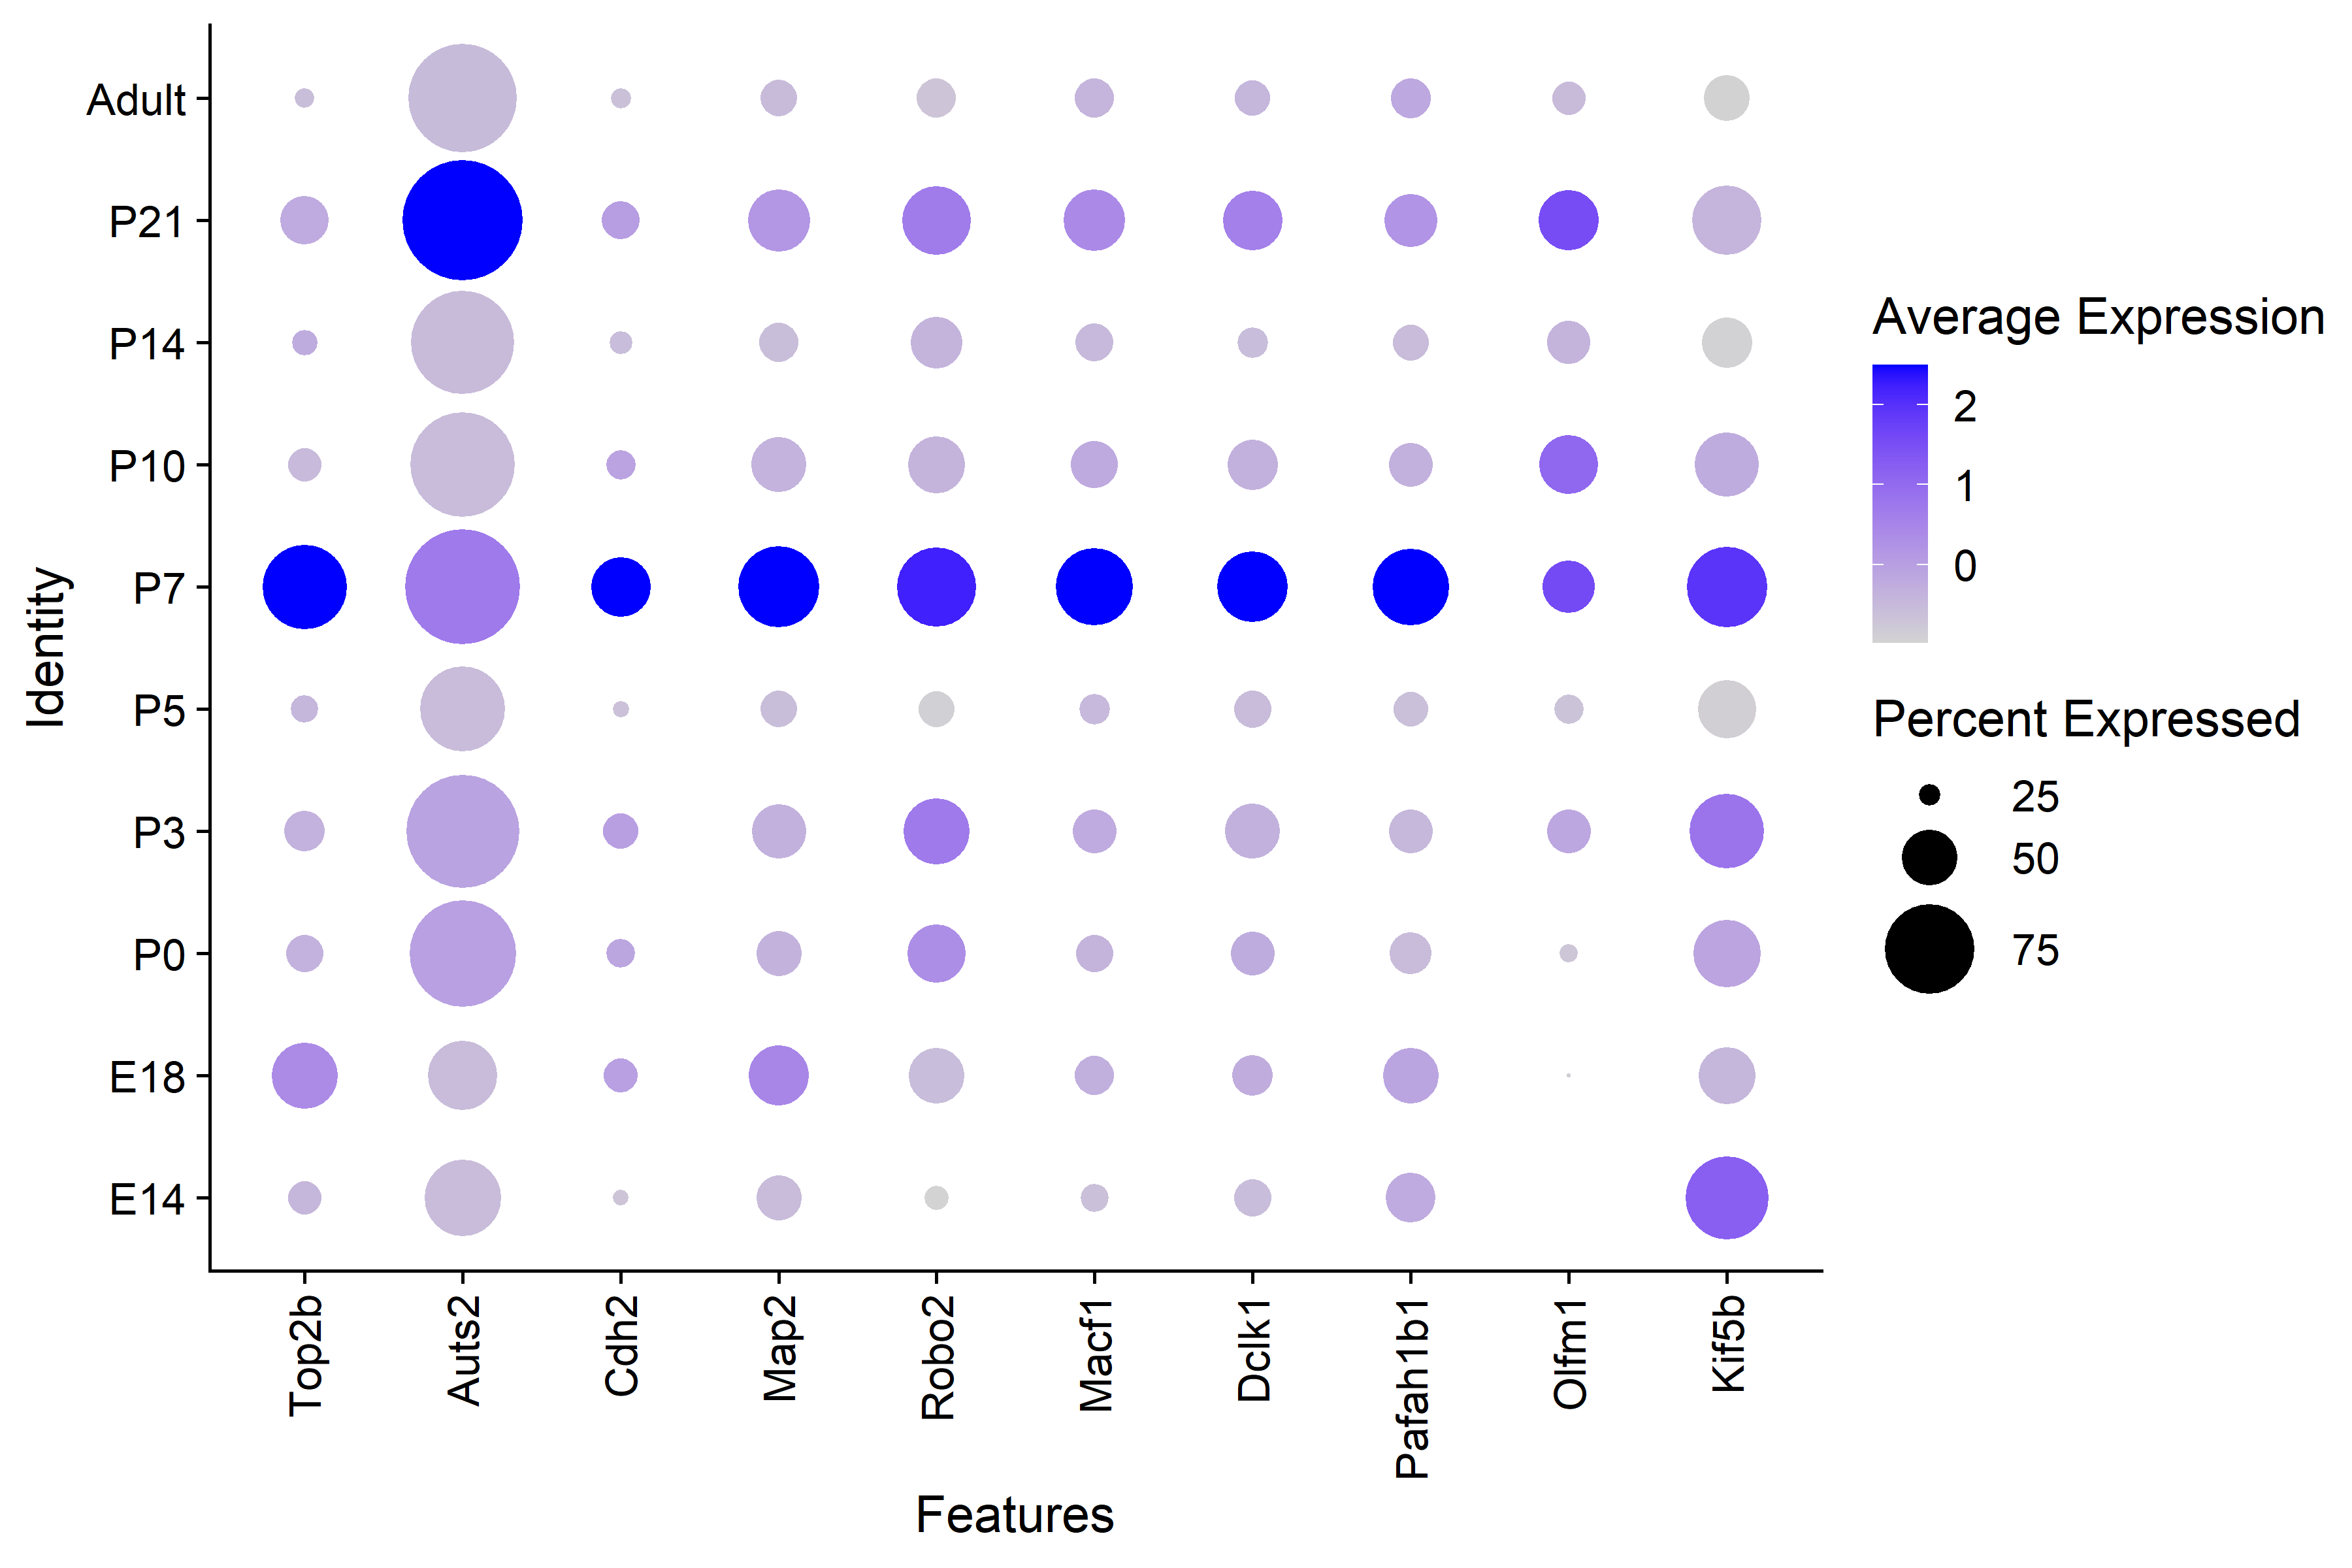 |
| There is clear higher average expression in P7 interneurons for GO axonogenesis genes with the exception of Auts2. |
| Figure 4. GO Term RNA Splicing Genes by Timepoint |
|---|
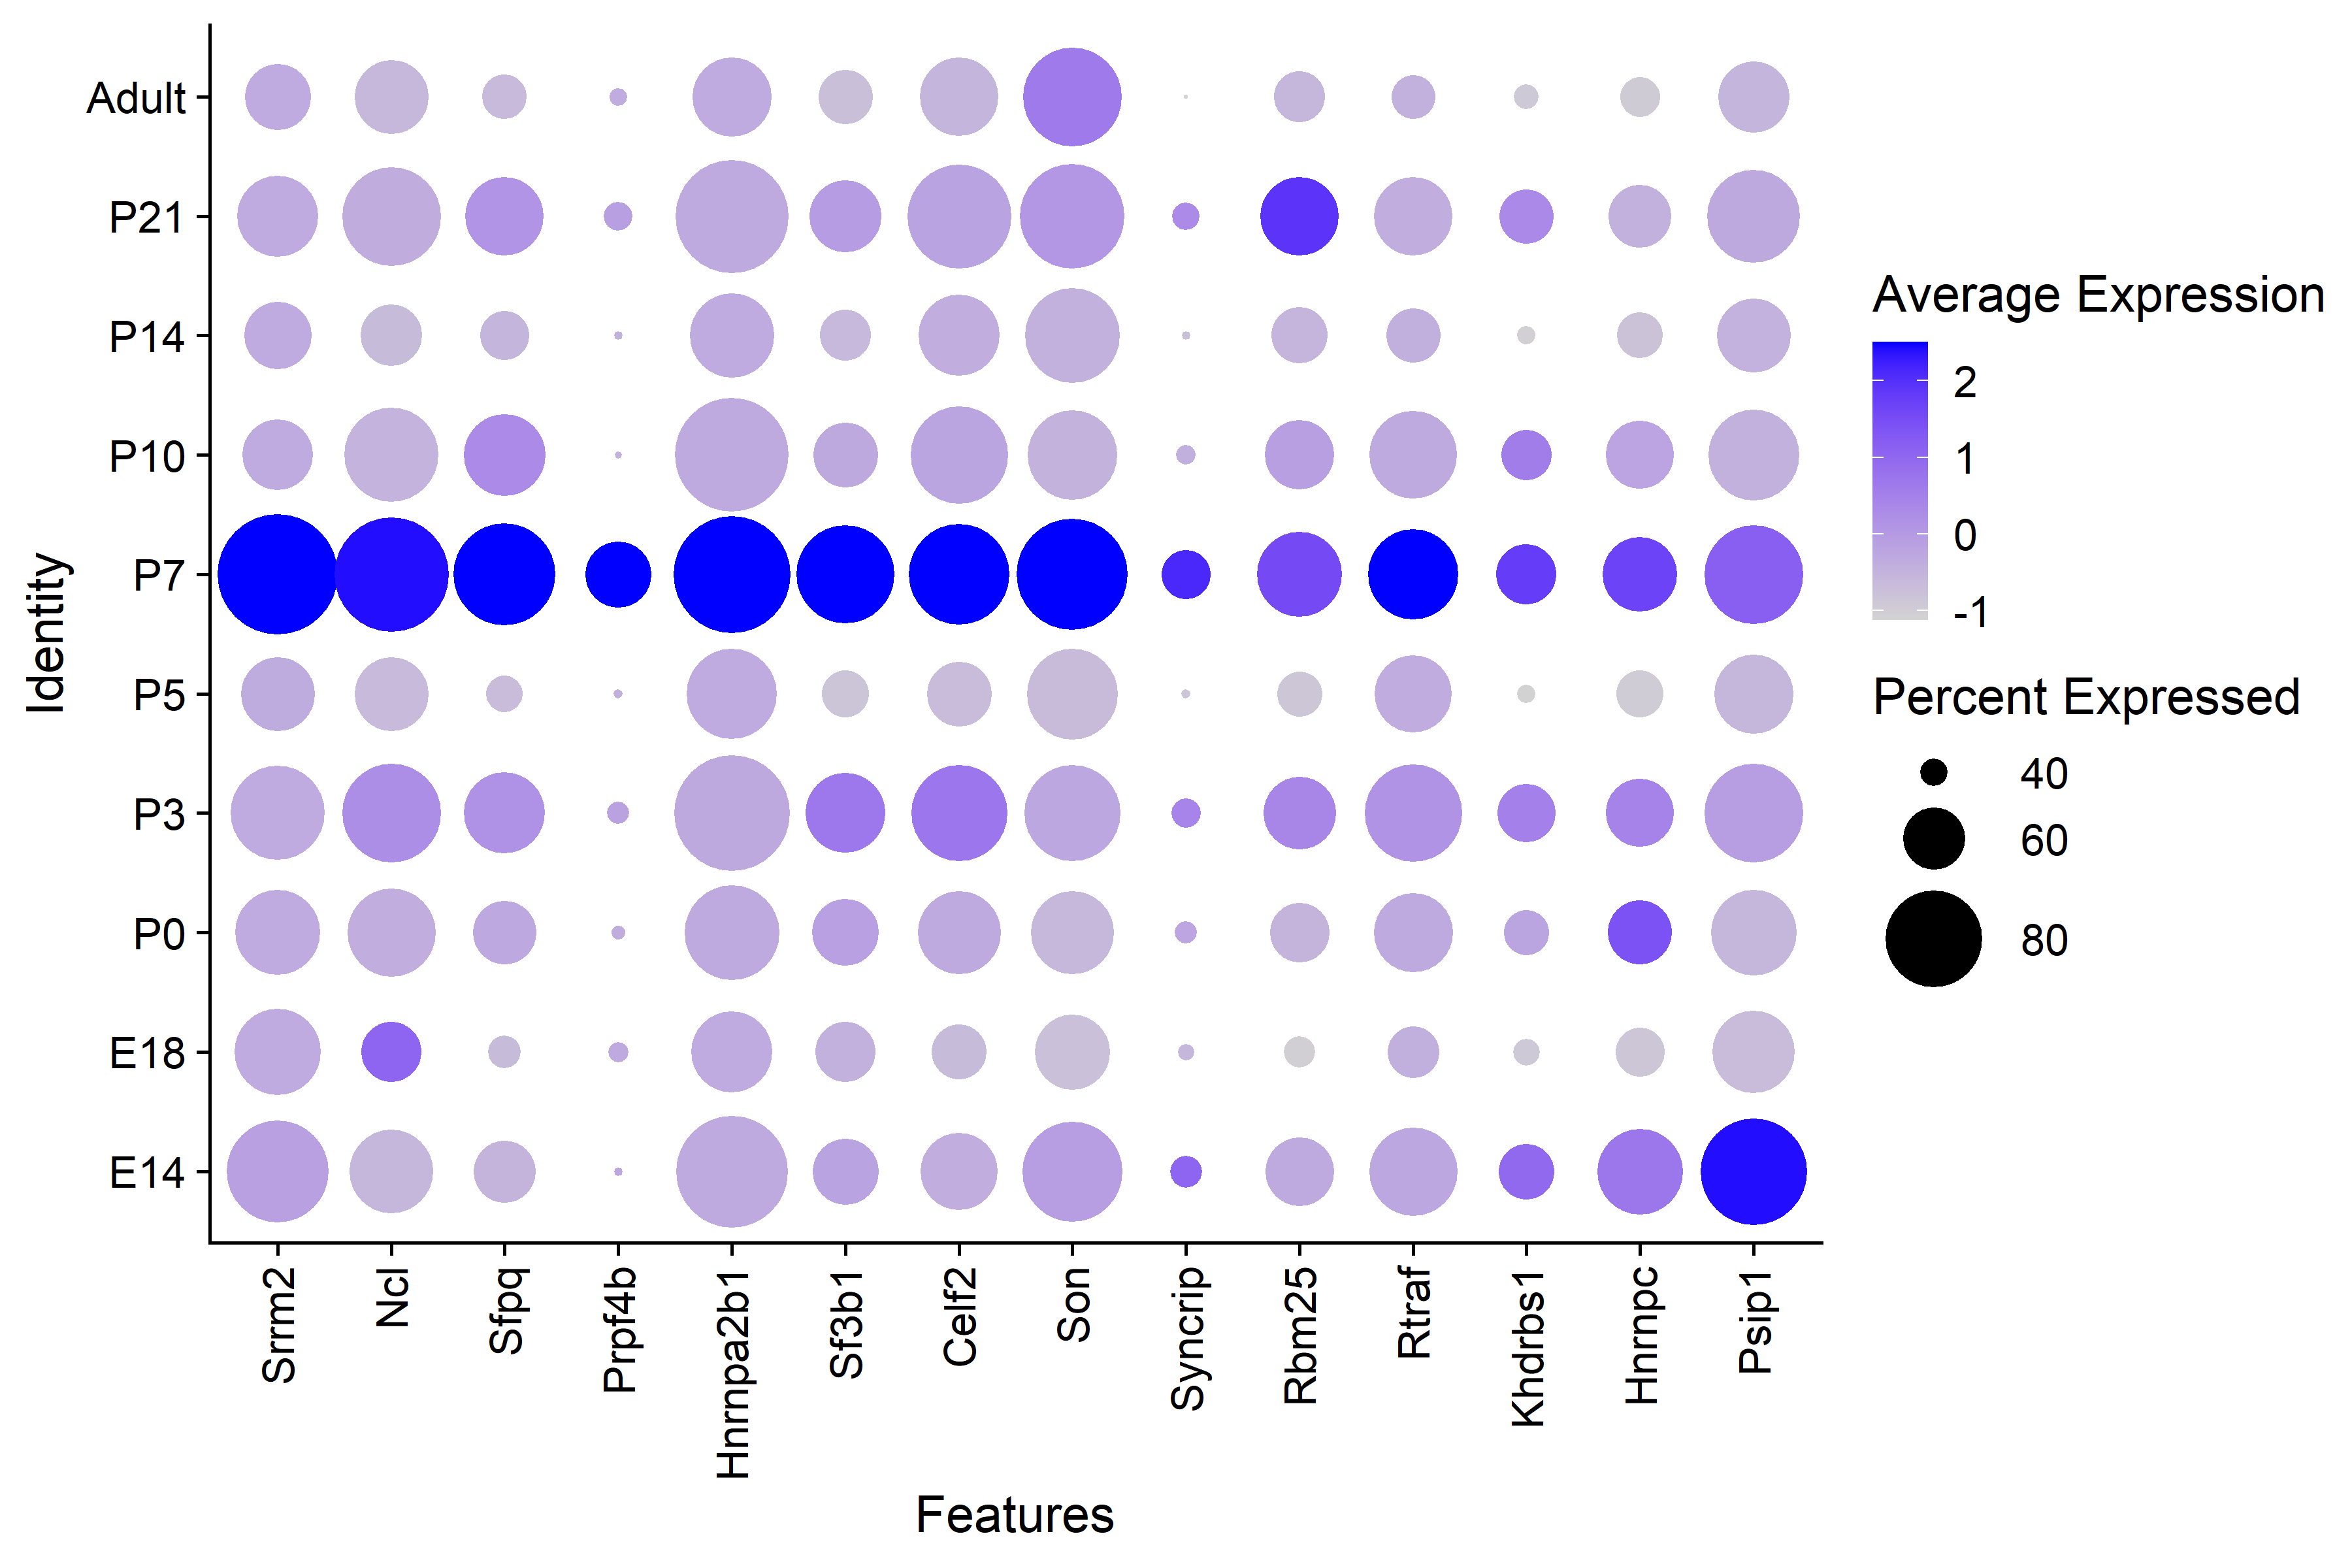 |
| There is clear higher average expression in P7 interneurons for GO RNA splicing genes. |
| Figure 5. KEGG Pathways overexpressed in the P7 cluster |
|---|
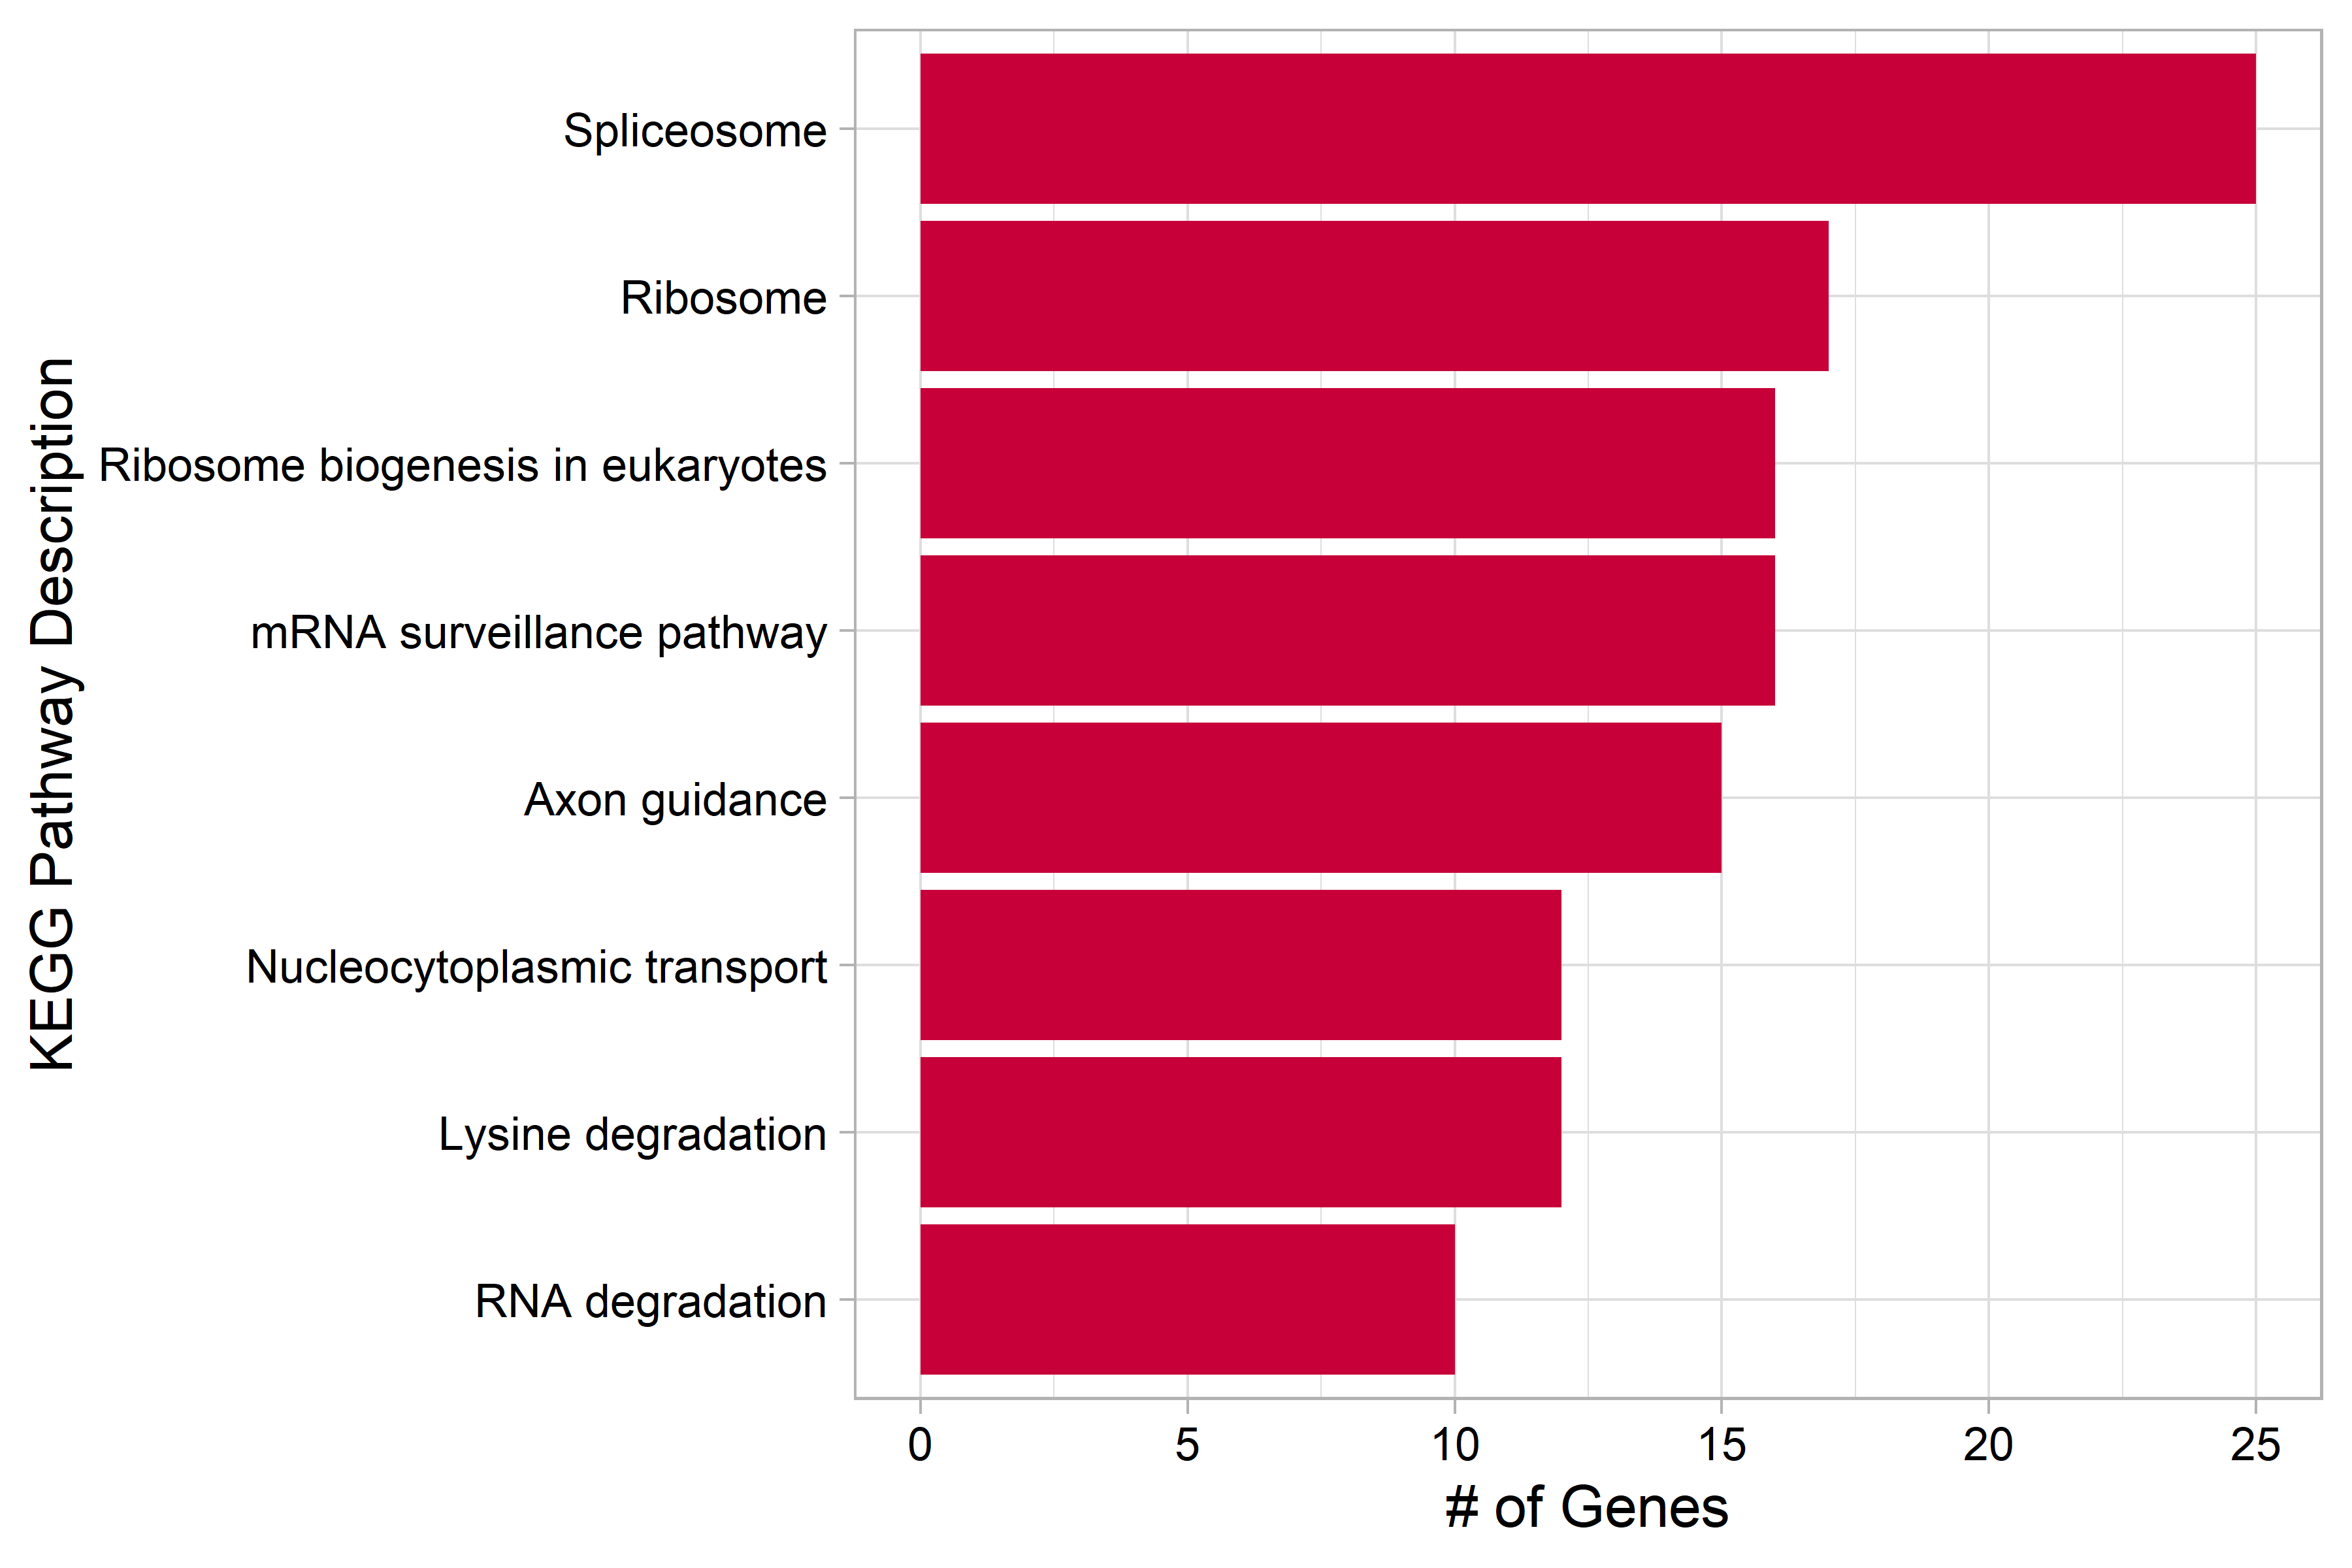 |
| Genes that were differentially overexpressed in the P7 cluster (p<0.01) were used for over representation analysis (ORA). |
| Figure 6. Network Plot of KEGG Pathways in P7 cluster |
|---|
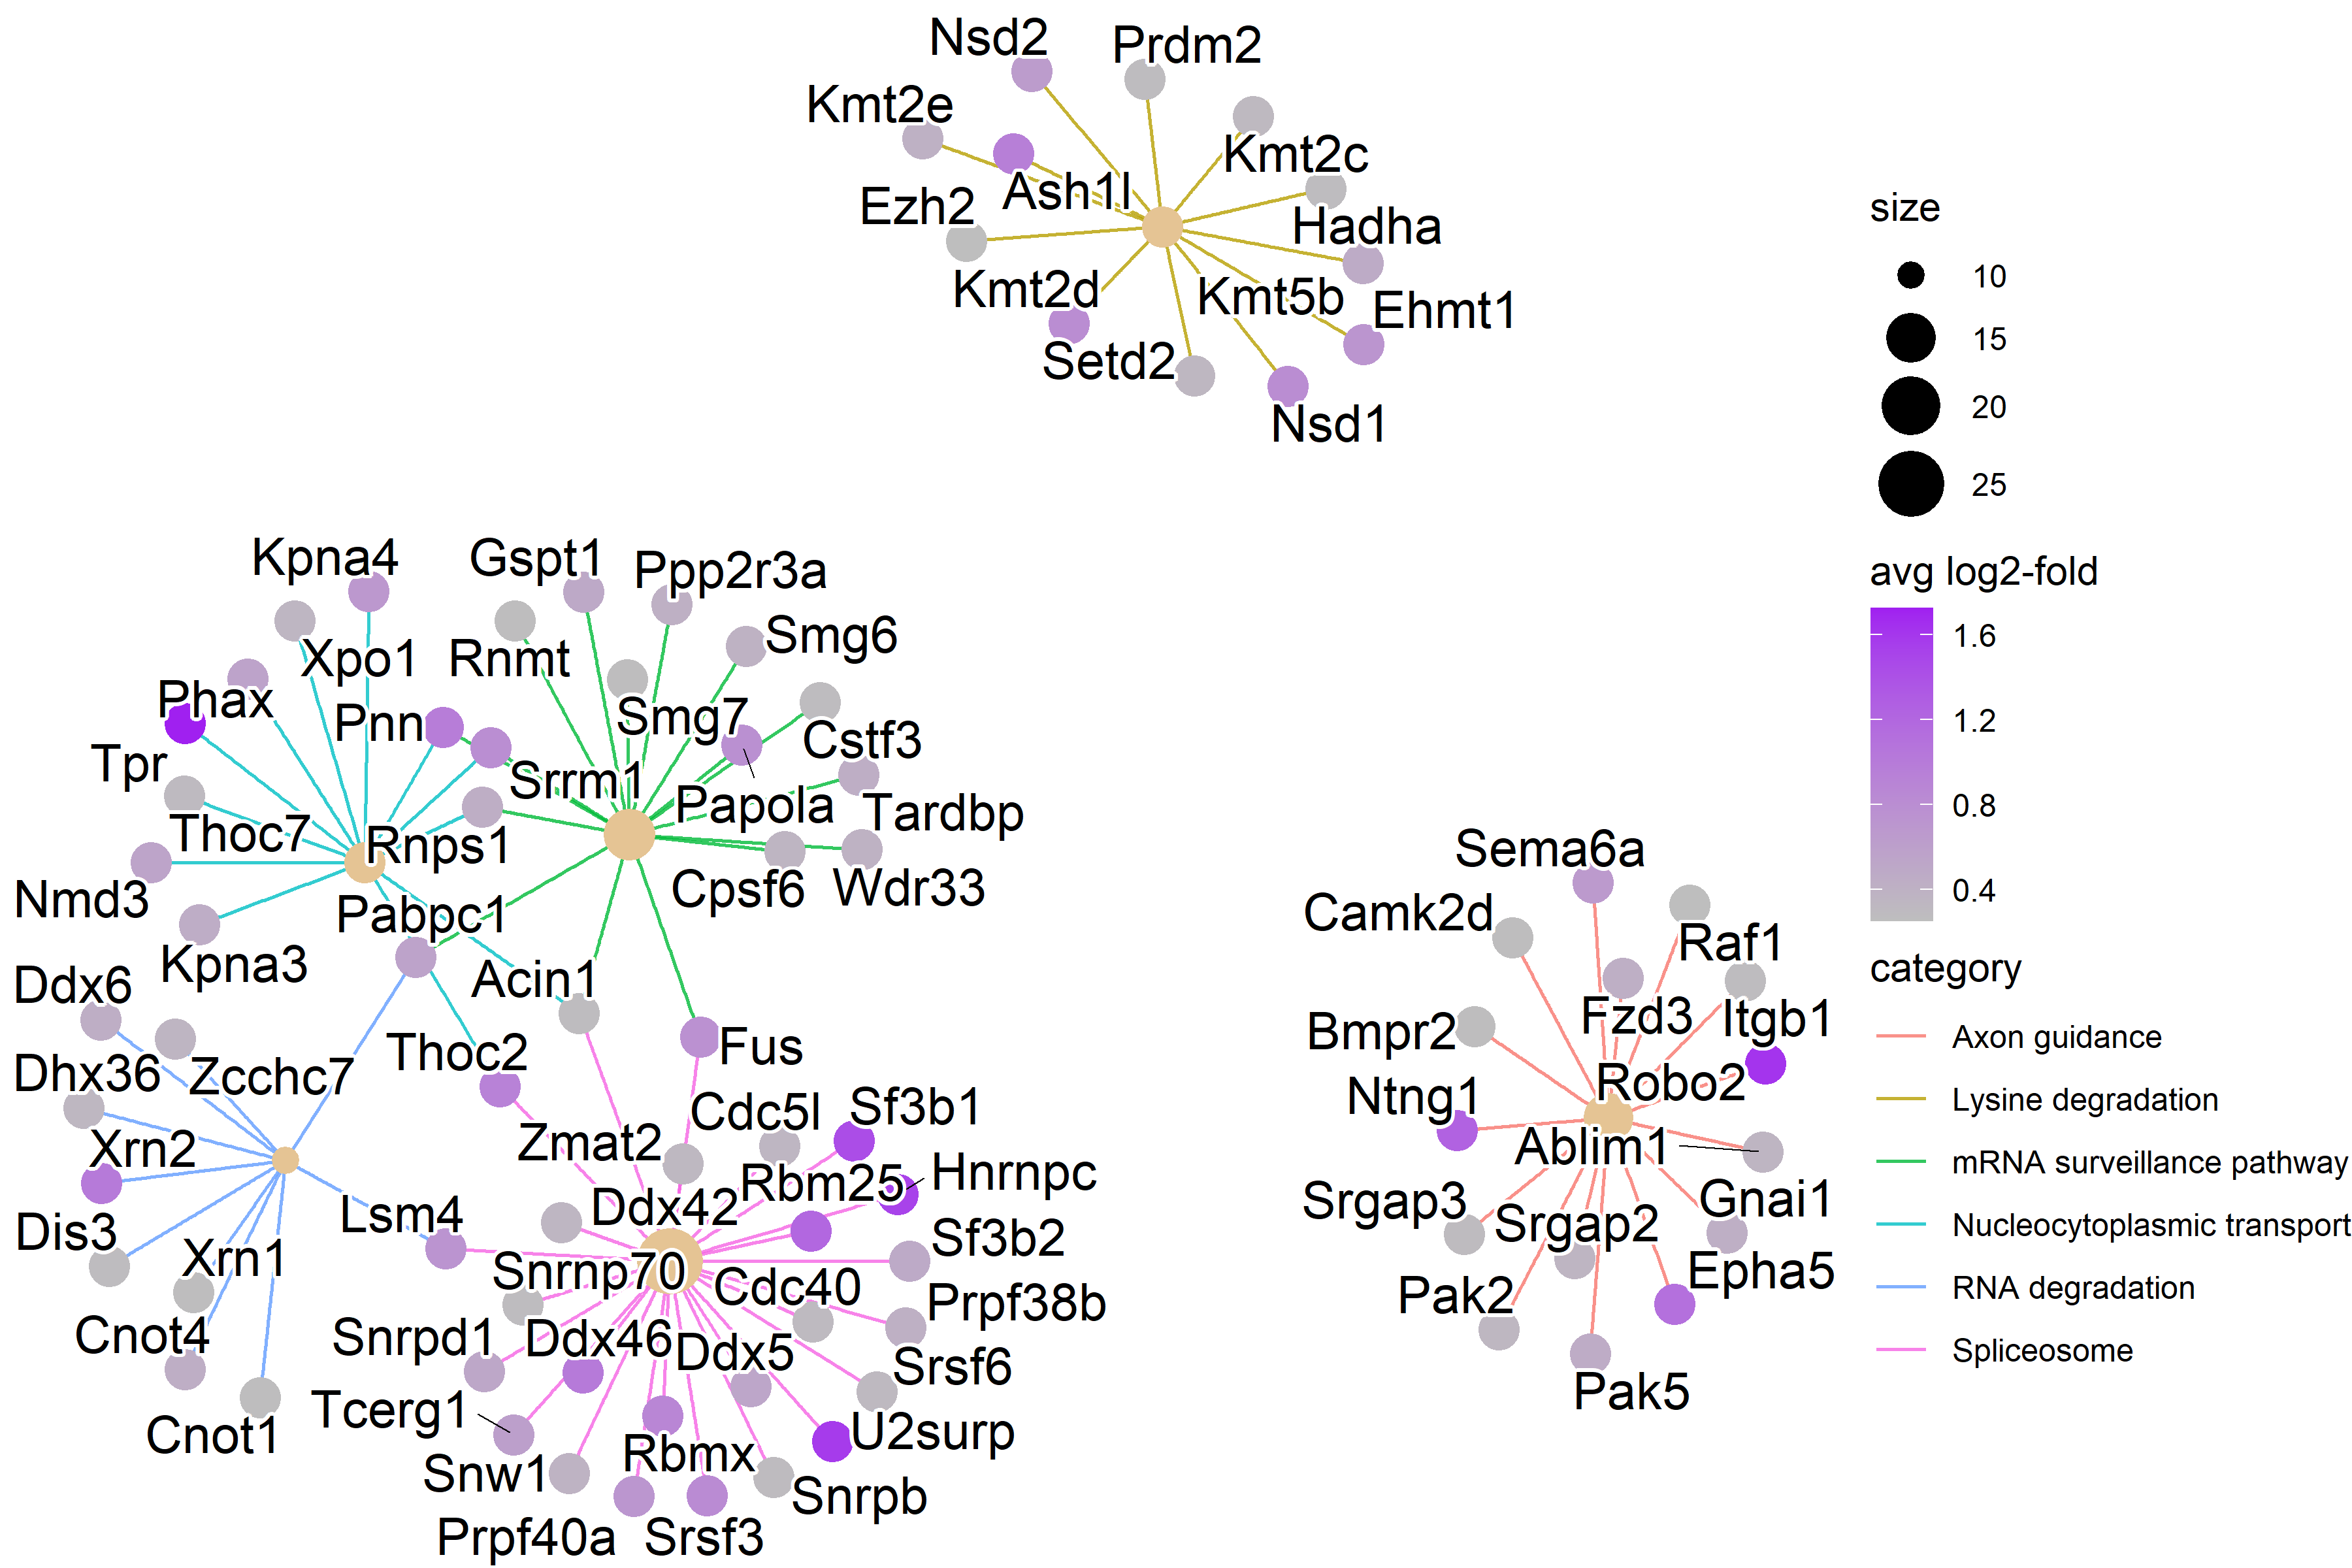 |
| RNA splicing KEGG pathways have high expression. |
| Figure 7. KEGG Axon Guidance Genes by Timepoint |
|---|
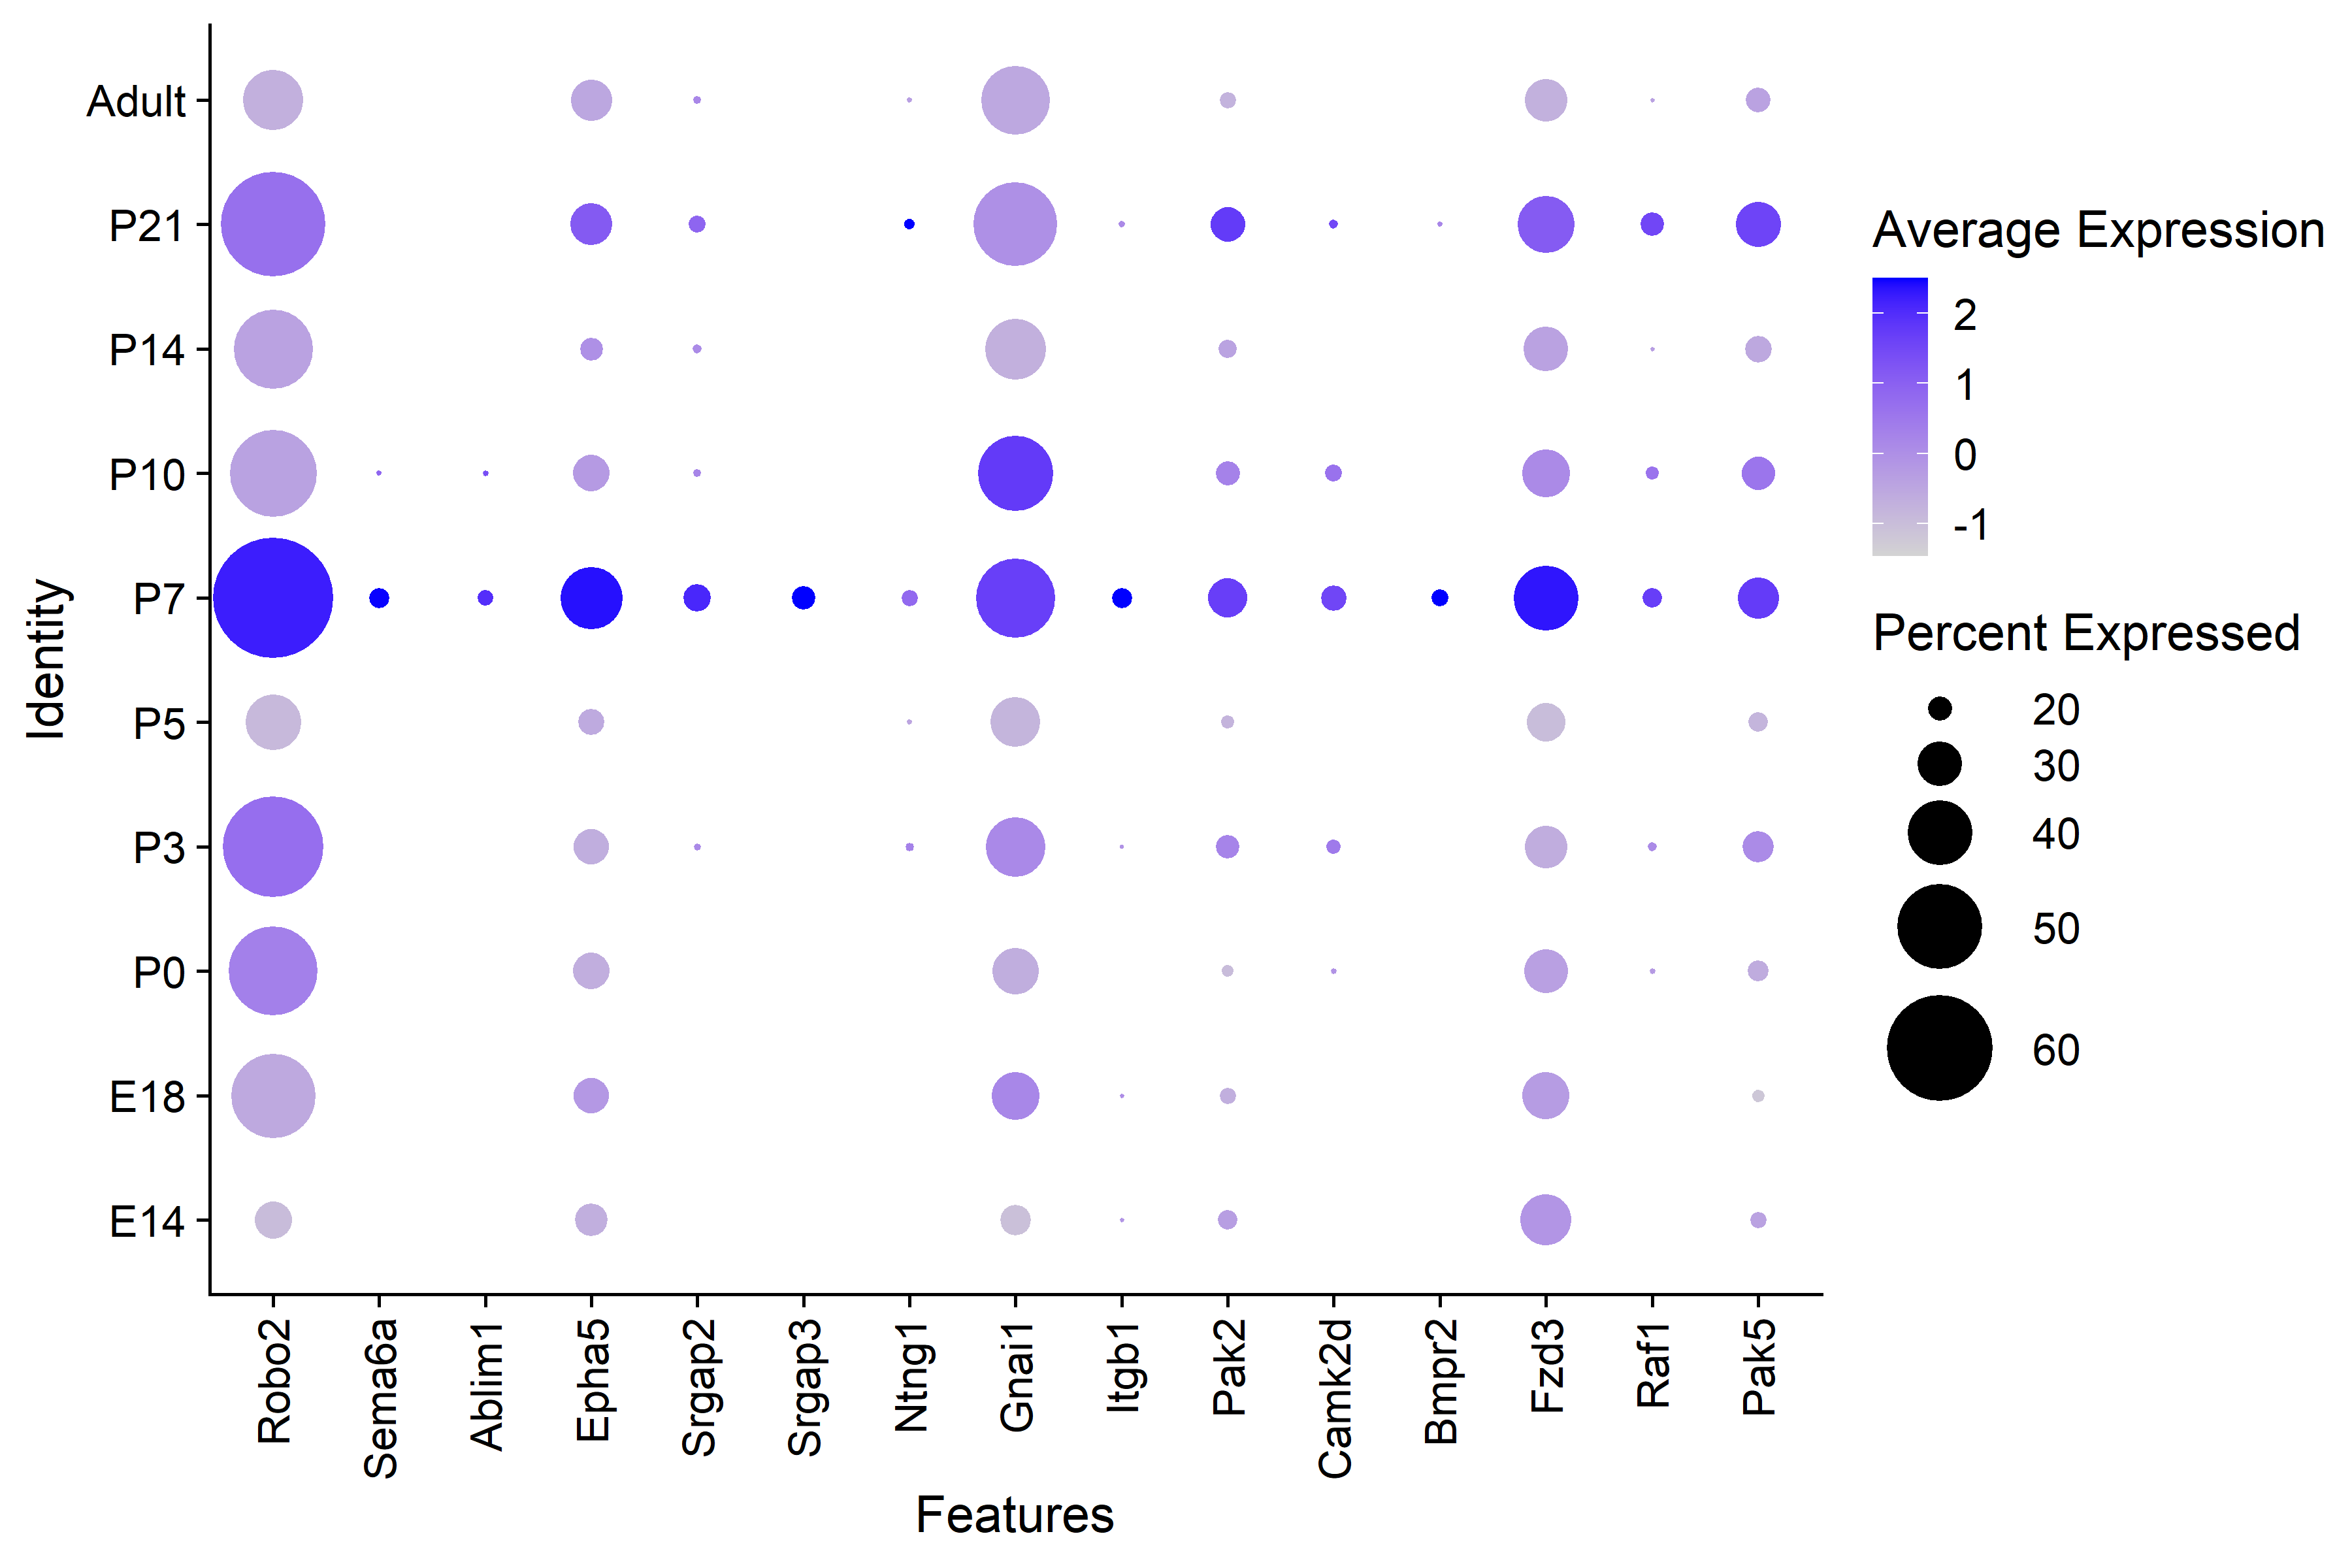 |
| The P7 interneurons have higher average expresssion across all of the genes in the axon guidance KEGG pathway. |
Genes involved in axonogenesis and RNA splicing have higher average expression in the P7 interneurons found through both KEGG pathway and GO term ORA. These results suggest that RNA splicing may play a role in axonogenesis and axon targeting of OSNs during the crtical perod of olfactory map formation.